Measuring Stress and Recovery – My Experiment During Davos 2019

What kind of physiological load does a human body experience during a week-long conference in the Swiss Alps, how does it compare with a normal week, and what measures could be used to evaluate this? I decided to take a dose of my own medicine and ‘sensor-up’ for a week in Davos to test my levels of stress and recovery.
I’m in the middle of a research project exploring the relationship between stress, recovery and cognition in knowledge workers. Participants are spending two-weeks wearing a Firstbeat Bodyguard 2 sensor, to continuously monitor heart-rate and heart rate variability as part of this investigation. I will not ask anyone who volunteers for a study to do anything that I have not tried myself, so I recently captured a sample of my own heart rate data using the device, during a normal work-week.
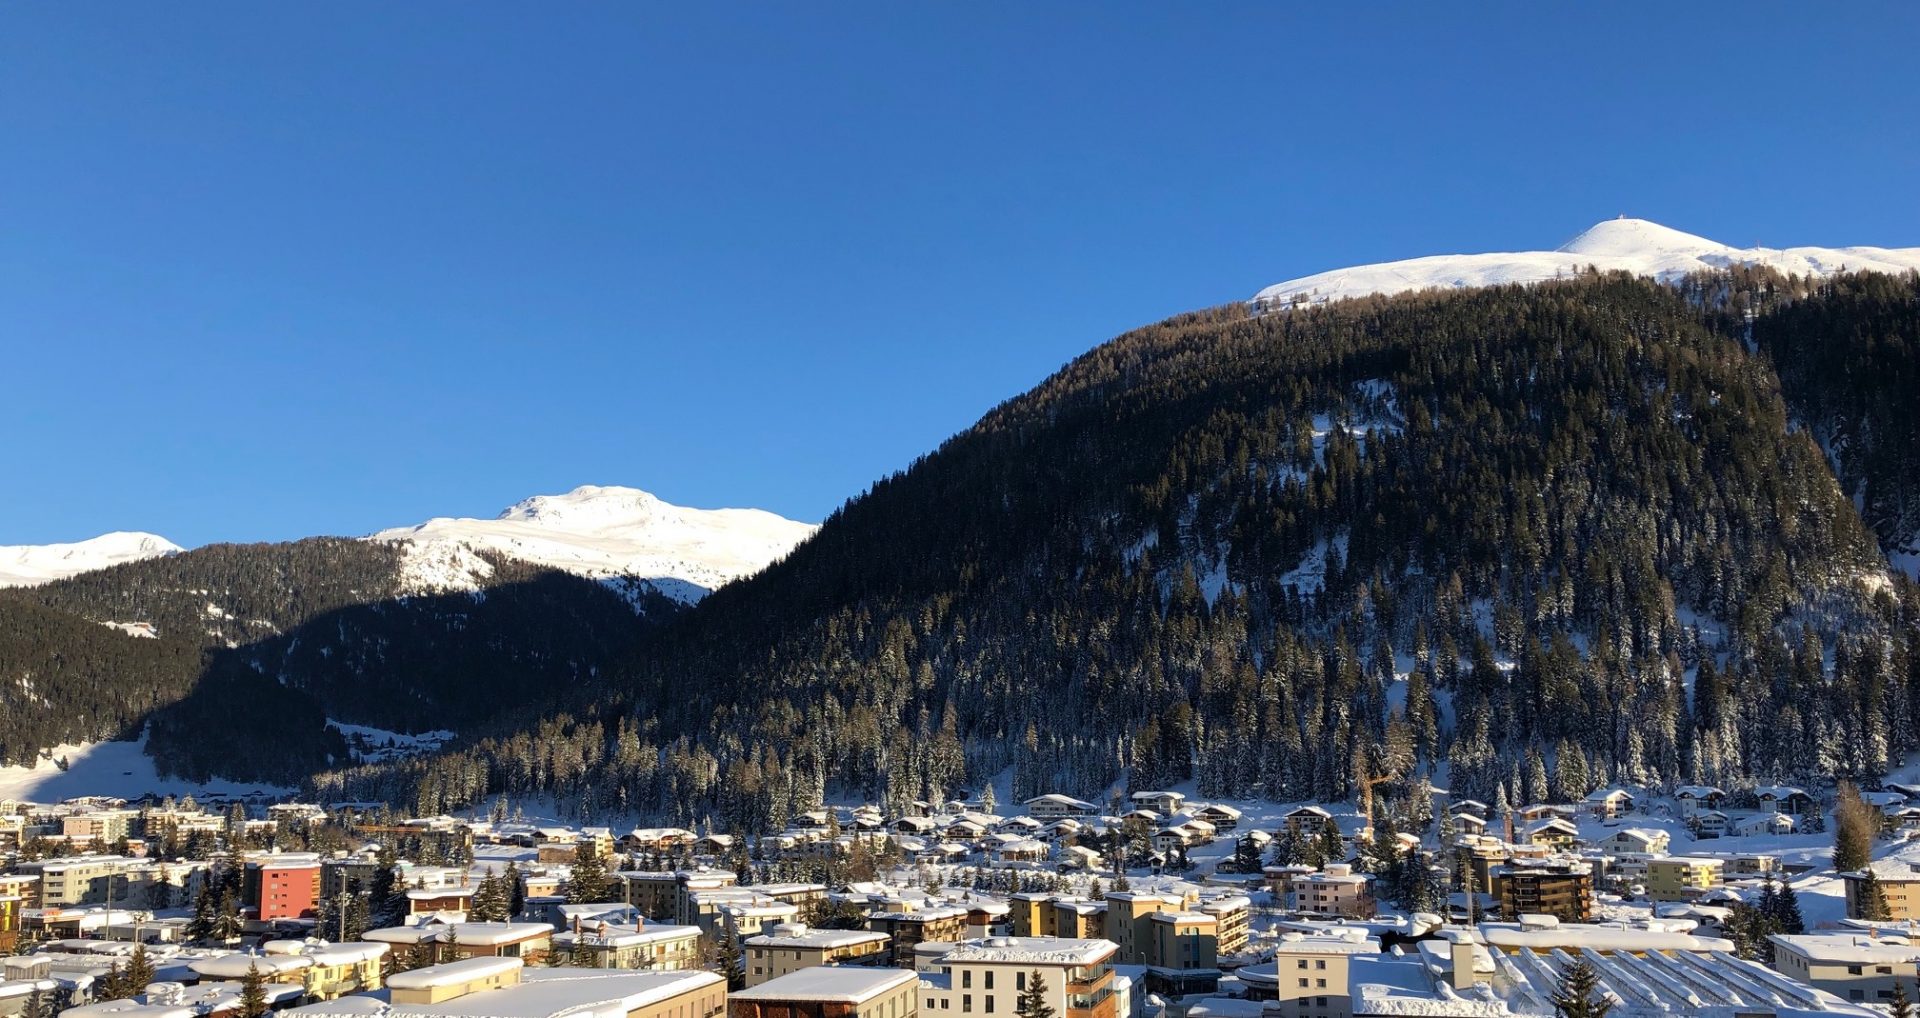
2019 is the fourth year that I’ve made the trip to Davos for the annual gathering of thinkers and leaders. This year, we were hosting a space alongside EMOTIV, and the FIA to highlight the impact of inadequate sleep on safety and cognitive performance. In addition to this, my week was packed with a wide range of commitments that would ensure I would be busy from morning until night. I decided to capture the second week of my own heart rate data during Davos, to compare with my normal week and better understand my own responses to stress and recovery. I measured four variables from Monday to Friday: resting heart rate, average daily heart rate, energy expenditure, sleep duration and rMSSD.
Resting Heart Rate as a Measurement
I measured and calculated resting heart rate as the lowest average heart rate recorded over the space of 1 minute, during each 24-hour period. As an absolute figure, resting heart rate is not particularly useful. My resting heart rate is low, which is likely a combination of genetic factors and the fact that I spent my late teens and early 20’s as a full-time racing cyclist, but just because someone else’s resting heart rate is higher than mine, it doesn’t necessarily mean that they are less fit, or recovered. However, measuring changes in resting heart rate over time can be used to suggest health and recovery status. For example, an elevated resting heart rate may suggest that our body is fighting off an illness, or that we are experiencing a time of particularly high physical or psychological load.
“Measuring changes in resting heart rate over time can be used to suggest health and recovery status”
Elevated Average Daily Heart Rate
Average daily heart rate is calculated based on 24 hours of heart rate data. This provides an estimate of the physiological effort associated with the day. A higher average heart rate suggests that I was exerting myself more, and vice versa, but there are a number of factors that can also influence this variable.
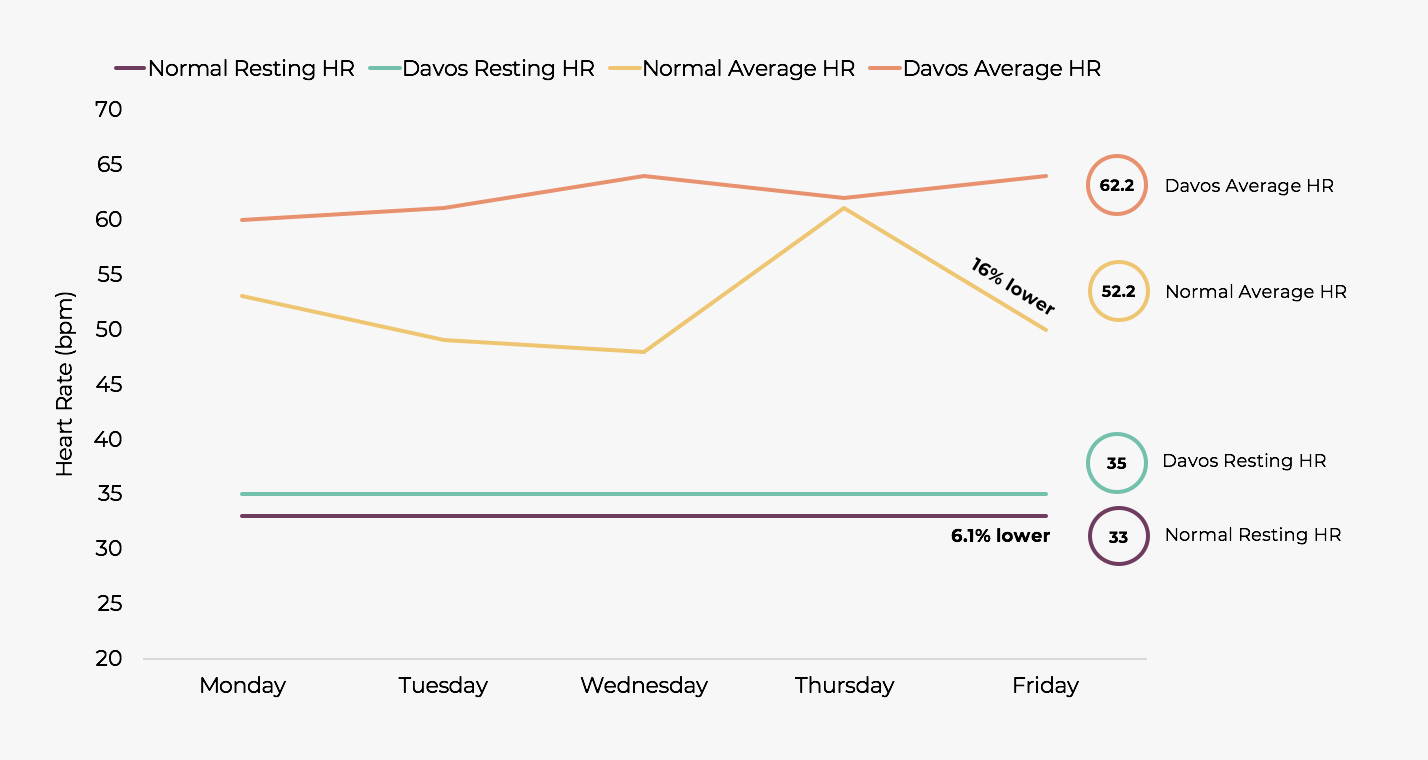
As you can see in the chart, my resting heart rate was slightly elevated during the week in Davos. In the normal week of heart rate data I used for comparison purposes, it was 6.1% lower. It also looks like the physiological load was higher in general. My average daily heart rate is usually 16% lower than during Davos. This is likely related to the fact that I spent most of the day on my feet in Davos where, in contrast, I tend to spend a lot of time sitting while I’m working from home, in the office, or while travelling. However, the other intervening factor is altitude. Davos is located at 1560m and, as a rule of thumb for a given intensity of effort, heart rate increases by approximately 10% for every 2000m above sea-level.
Less Structured Training but Same Energy Expenditure
Energy expenditure can be estimated from the heart rate data, and I decided to use it as another proxy for the physiological effort in the week. In my ‘normal’ week, I completed 2 exercise sessions. In Davos, I wouldn’t be exercising in a structured way, but I knew I would be walking around more than usual.
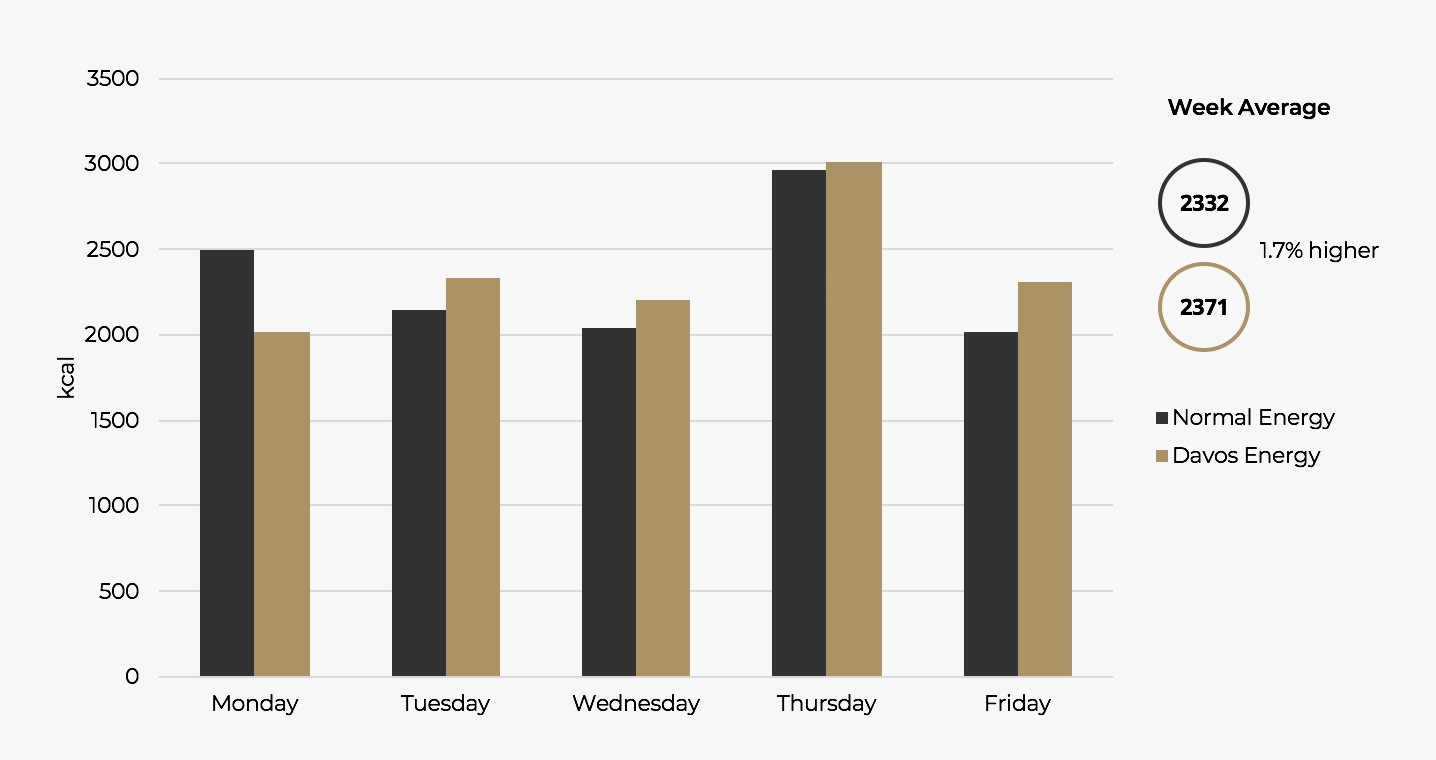
Overall, my energy expenditure was similar during Davos as in the normal week of measurement. However, it’s interesting to note that this was achieved without any structured exercise or training. On Monday and Thursday, during the normal week, I did two training sessions which increased my energy expenditure by between 500-750 kcal for those days. During Davos, the greater amounts of walking around on Monday, when I needed to collect badges, equipment and get set up for the week, and Thursday, when I had a lot of meetings around the town, compensated for the lack of structured activity.
Accumulating a Sleep Debt
We know the sleep duration is crucial for health and performance, but it’s not always possible to sleep adequately, particularly during conference weeks such as Davos. I was interested to record sleep duration relative to a ‘normal’ week and explore whether I could find any correlation with the other measures.
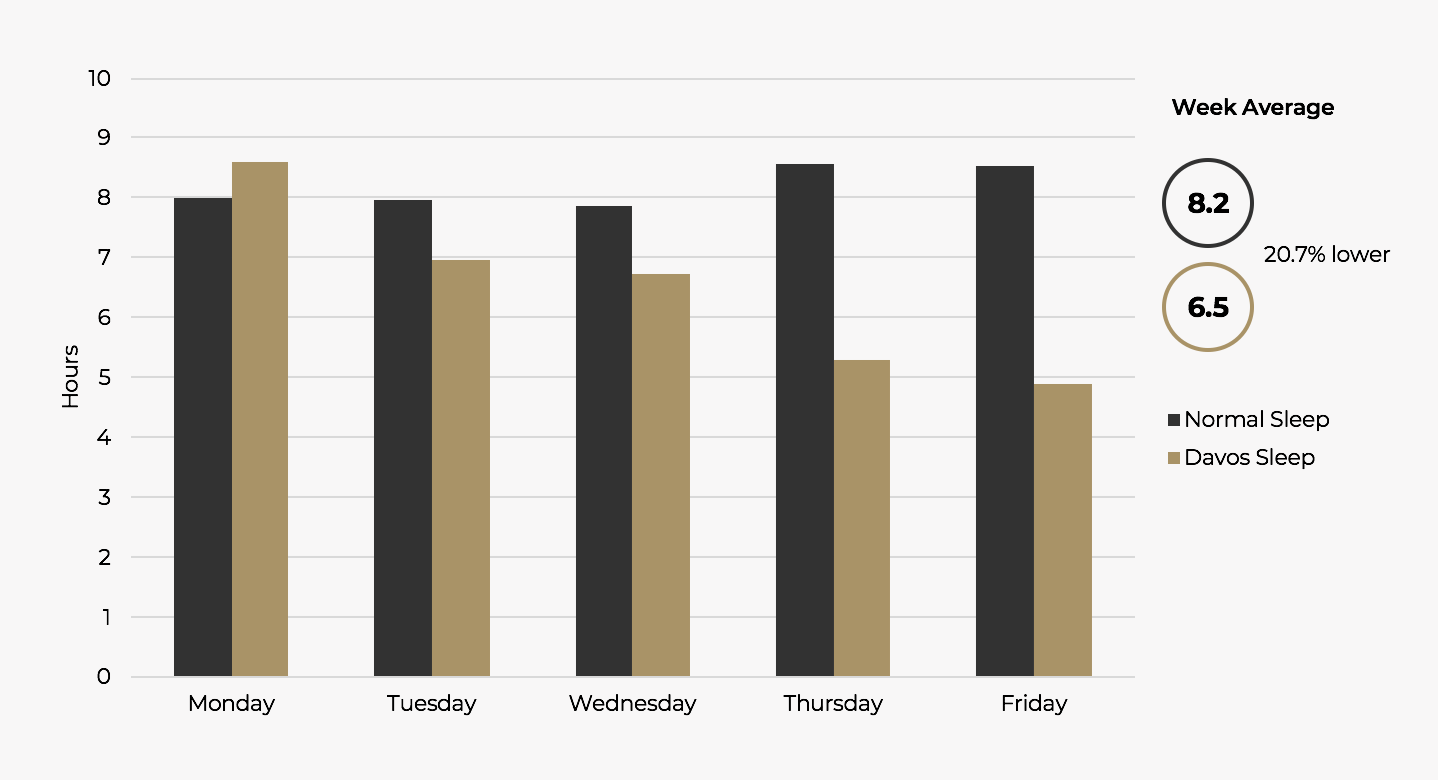
Unsurprisingly, my average sleep duration was over 20% lower than normal. By the end of the week, I accumulated a sleep debt of over 4 hours, and this likely contributed to the higher resting heart rate and reduced recovery, as we can see based on rMSSD.
More load, less recovery
The Root Mean Square of the Successive Differences (rMSSD) is a measure of ‘heart rate variability’. It describes the difference in the time-interval between each heartbeat. This measure can be used to infer the state of our body’s parasympathetic nervous system – the rest and digest branch of our nervous system. It’s a simplification, but it can be helpful to think about rMSSD in the following context: when we are relaxed and recovered, our nervous system is able to quickly adjust to small and subtle changes in our internal and external environment. This capacity to quickly adapt and change is reflected as higher heart rate variability. When we experience physical or psychological stress, and we are not recovering well, the activity and variability of our parasympathetic nervous system is reduced, which is reflected in lower heart rate variability and a smaller rMSSD figure.
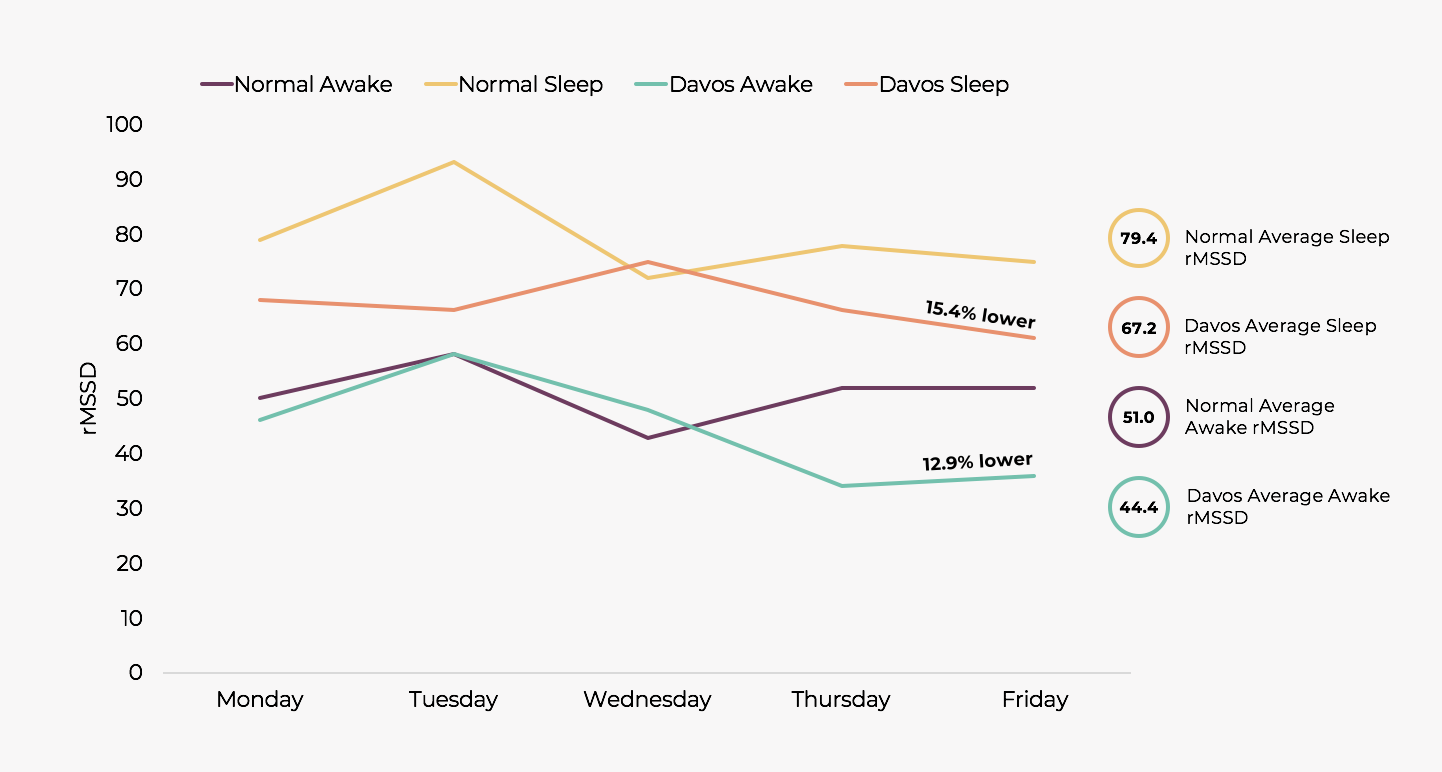
In general, higher rMSSD indicates a better state of recovery and lower stress relative to a lower rMSSD. It’s also interesting to compare average rMSSD between wake-time and sleep-time, as I’ve done in the chart, above. The difference between wake-time and sleep-time rMSSD can provide a sense of how well you’re recovering during sleep. Ideally, you would hope to see a significantly higher rMSSD during sleep, as your ‘rest and digest’ system is more active, relative to during the day.
You can notice this trend both during the ‘Davos week’ and ‘normal week’. The ratio between waking rMSSD to sleep time rMSSD was similar, however, the data also suggests that I was not recovering as well, and was likely experiencing a higher physiological load and/or stress during Davos. My average rMSSD was 15% lower while sleeping during the week in Davos, and 13% lower while awake, relative to normal.
Key Learnings
This brief self-experiment highlights a number of points:
- The amount of energy we expend is an important factor in maintaining a healthy body mass, but it’s important that we don’t ignore ‘incidental activity’ when we consider how much energy we are using. I was aware that I would miss a couple of exercise sessions during Davos, so I was pleased to note that that extra walking around compensated for this. If you are travelling and don’t have much time to exercise, simple decisions such as taking the stairs, instead of a lift, can accumulate and offer significant health benefits. However, energy expenditure is just one piece in a larger health, fitness and performance equation. Resistance workouts and more intense cardiovascular exercise have many additional benefits, so should not be ignored.
- It doesn’t surprise me to see that my increasing sleep debt is reflected in decreasing rMSSD (reduced recovery) during the week, but personally, I find that estimating the impact of this numerically (15% lower than normal), encouraged me to prioritise recovery more, when I got home.
- A week in Davos is measurably more effortful, and more demanding in terms of lack of recovery, than an average week. It would have been interesting to add some self-report measures about perceived stress, performance, and also tests of cognitive function, as I’m doing in my current study, and also chart my recovery from the week, in the days after the event. Maybe I’ll follow up with another self-tracking period at some point in 2019.
I’m pleasantly surprised by how much useful data I acquired passively during the two-weeks of tracking, simply using a wearable device. Many of the insights are intuitive, but I found it interesting to quantify my experience. There are a wide range of wearable devices offering this kind of data, and as they begin to be used more widely, I’m interested to see the ways in which this data can improve our understanding of wellbeing and performance, in particular how we can recognise the extra load imposed by these kinds of experiences, and also consider how best to recover from them.
If you’ve done any similar self-experiments, I’d love to hear from you. You can also find out more about the ‘Davos Brains’ experiment we conducted during the week on a video interview I did together with EMOTIV’s Olivier Oullier, and if you’re interested in finding out more about Hintsa’s services, some of which include tracking periods such as this, please get in touch.
Interested in hearing more about our coaching services? Leave your contact details below and we’ll be in touch.